You probably know what a microservice is, you also probably know about APIs, and in particular REST APIs. But… do you also know what tcpdump is? Let me explain why do I think it is one of the best tools when working with APIs.
Sometimes when I think about what I use on my daily work, my favorite tools and software, what comes to my mind first is the IDE or the editor of choice for the task. Or if I think of something even more critical to me well Ubuntu, Firefox… things I can’t replace without crying a lot. Or maybe more specific tools like Postman or git. But I never think of small things, those that you have or install in almost every single machine you ssh in!
This post is for one of those small things that are always there when needed (or as far as an apt-get install command away) and that can save you hours of time easily. This post is for tcpdump.
A bit of history

tcpdump was created in 1988 by a team of network researchers at the Berkeley Lab. In 1988 the Internet was still very young: HTML and browsers did not exist until 1990.
They needed something to find out why ARPANET was collapsing but didn’t like etherfind, a tool written by Sun, which was problematic and slow. So they started working on a way to filter packets efficiently and this is how tcpdump was born ?.
After that they separated the packet capture and filtering logic into a library so other applications could benefit from it, and libpcap was released.
Finally they also defined a file format (*.pcap) that all these applications could use to store and share traffic captures easily.
Such a great engineering work! Almost 30 years have passed and we still use it. Oh and tcpdump/libpcap is free software (BSD license), which means you can use it both in free and non-free software.
Back to now and here
Have you ever logged into a server to find out what’s going on with that microservice/API and thought: «it would be great to see the requests«. Or maybe on your own machine, you are using an API client and for some reason it’s not working as expected and you would like to see what the request that client is sending looks like… or the response to that request.
Well, that is just one command away. Two if you have to install tcpdump. You can see both requests and responses, in real time, in your terminal. ? You can filter them, store them to inspect them later with Wireshark… still not impressed? Oh come on, you can feel like Cypher watching what’s going on with all those bytes hitting your API!
In a world embracing microservices, where JSON APIs are everywhere tcpdump is more useful than ever. I am not saying you should not use other methods to store and analyse traffic, cause there are really good ways to do that (I personally like the ELK stack) but you don’t need that complexity to just see traffic on a machine.
There are visual tools too, like Fiddler and Charles, but you can’t use them on a remote machine when all you have is an ssh connection.
Show me the bytes
Okay, before you look into the next picture: tcpdump output isn’t beautiful. Probably because TCP was not designed to look beautiful to humans 😀
So don’t panic when you start to see TCP flags, weird symbols and dots. And keep in mind that one HTTP call is not just one packet on TCP.
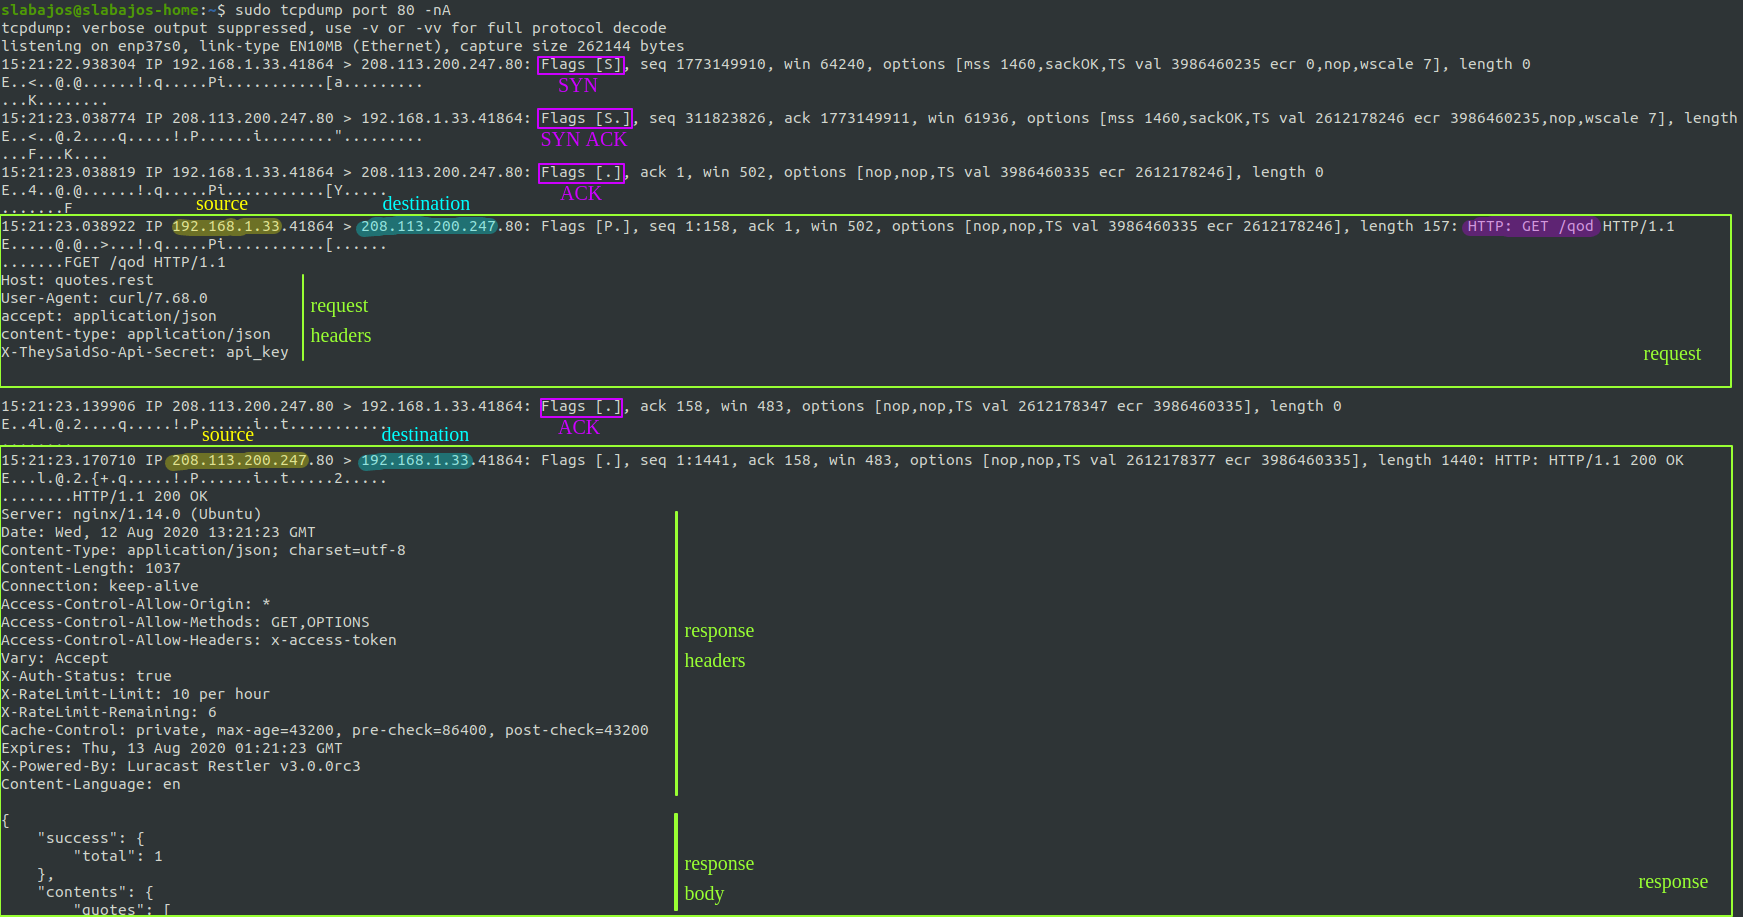
This is the output from tcpdump when I do a GET request to an API endpoint that returns the quote of the day: http://quotes.rest/qod
Don’t worry about the command now, let’s focus on the output first. As you can see there are a few packets there for just a request and a response:
- First packet is from my computer to the server, and is a SYN packet as the Flag shows (highlighted in purple).
- Second packet is from the server to my machine, and it is a SYN-ACK.
- Third packet is an ACK from my machine. This completes the famous 3 way handshake and it means the TCP connection has been established. Good job TCP ?
- The 4th packet is the actual request that I made, finally, requesting /qod to the server.
- Server responds with an ACK. ?
- Server sends the response to my request. And you can see the start of the JSON body with the quote of the day.
Now you should be able to quickly identify the interesting parts when using tcpdump, usually the request and the response. As you saw they are easy to spot: they are big chunks of kinda readable text.
Real life examples
Ok, now that we are no longer scared of tcpdump let’s see some examples. First of all, if you just run tcpdump you will see all the traffic from and to your machine. There is a lot going on and it can go FAST. That’s not very useful, you need filters depending on what you are looking for.

Capture traffic on localhost
Lets imagine you want to see traffic from your machine to your machine. If you have an API running on localhost:8080 that is receiving requests from your own machine, like when using Postman, you can use this command:
sudo tcpdump port 8080 -i lo
Explained: in this particular case the traffic is not going to leave your machine, and thus you have to tell tcpdump to listen on «lo», or whatever your loopback interface is called (you can find it out with ifconfig). And regarding «port 8080» well, that is a filter! It only shows packets going to port 8080 or coming back from port 8080.
Capture traffic on a remote machine
Another scenario: you have something deployed on a remote machine, listening on port 80 for example and you want to see requests coming from a specific client:
sudo tcpdump port 80 and src 1.2.3.4 -nA
Explained: as before, «port 80 and src 1.2.3.4» is the filter. It will capture packets from/to port 80 and from client «1.2.3.4». This means that you will only see the request and not what the server is sending back to the client (the response). If you want to see both requests and responses from that client:
sudo tcpdump 'port 80 and (src 1.2.3.4 or dst 1.2.3.4)' -nA
Now you can see everything. Note that we are now using a couple flags:
- -n tells tcpdump not to translate IPs into names.
- -A tells tcpdump to print packet bytes as ASCII. This is helpful when you want to see requests that contain JSON for example or some sort of readable data (HTML, XML, text…).
Capture and save it for later
Sometimes you just want to capture traffic and analyze it later more carefully. You can do that with tcpdump, just append -w captured.pcap to any tcpdump command and stop it when you feel you have captured enough packets. Or you can limit the number of packets or the size of the pcap file with -c and -C.
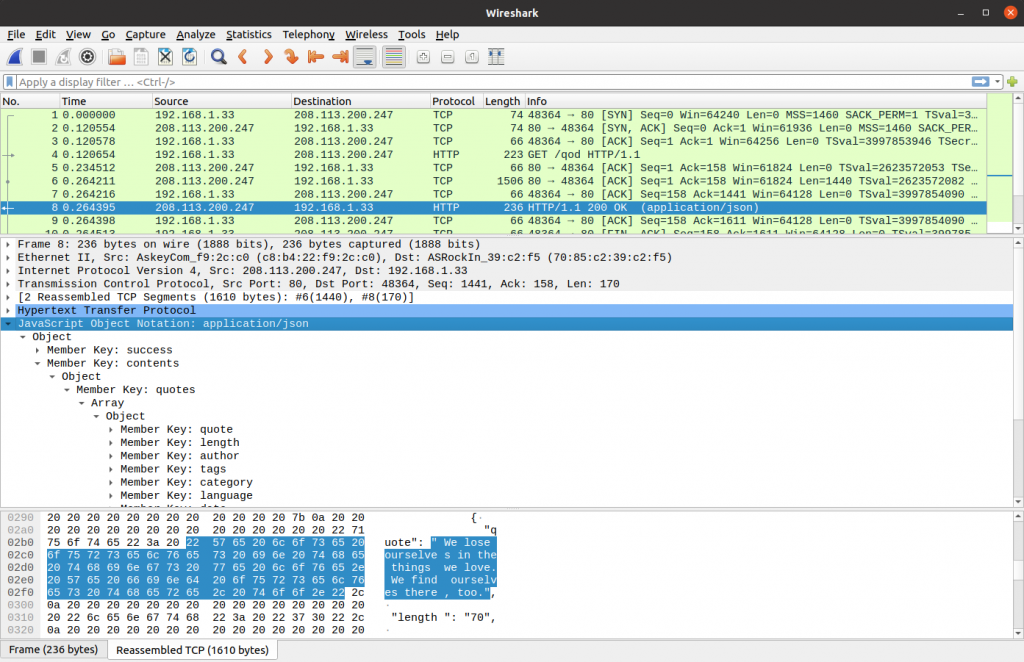
After that you can open the pcap file with Wireshark, a visual tool that is built on top of libpcap and is thus 100% compatible with pcap files.

Tcpdump and grep
Why not? You can use grep with tcpdump to find that request that is driving you crazy. I usually do this with the endpoint that I want to troubleshoot or with something I know the request/response will contain, like a word or an identifier:
sudo tcpdump port 8080 -nA | grep something
I would suggest using grep with -B and -A to show a few lines Before and After the match (context). Otherwise you will just see random lines of the tcpdump output. Here is a better version of the command:
sudo tcpdump port 8080 -nA | grep something -A 10 -B 10
I don’t usually need more advanced filters but if you are interested in learning more here is the manpage: man tcpdump
Wait, what about performance?
Theory says that tcpdump is fast. And that filters are compiled and optimized but is it a good idea to capture traffic in a production environment? will I break anything?
Well, lets check it out. I’ve created a dummy server with Node.js that just returns a bunch of JSON to the client on port 80. Deployed it on a single core, 512MB RAM server on DigitalOcean and tried 3 different scenarios:
- No tcpdump
- Capturing traffic on port 80 and storing it on a pcap file
- Capturing traffic on port 80 and displaying it on the console with -A option
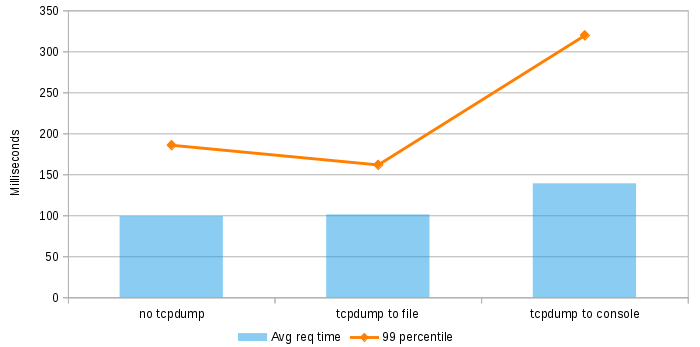
I have used Apache Benchmark to make 100.000 calls on each one of these scenarios, with 100 concurrency and measured the results:
So it seems that watching traffic as ASCII on the console hurts a bit. But not too much, I mean, I have printed 100k packets. There is no point in printing that many packets, you won’t even see them that fast! So just make sure to use filters.
And storing traffic on a pcap file seems to be quite cheap (at least in terms of response time), as long as your requests/responses aren’t huge. For this scenario the pcap file was 150MB and contained around 1M packets. If your traffic has image data you should be more careful probably.
Thanks!
That’s it, thank you for reading! Feel free to drop a comment if there is anything unclear or wrong. Oh and if you know someone who might benefit from this, share some tcpdump with him/her!
I want to thank Julia Evans for helping me realize how much I love tcpdump. She writes a lot about different linux tools, she even draws magazines about them! That’s so cool and inspiring!


