This is the second part of Hypersonic game: programming a bot for fun (Part One), I recommend reading the previous post before.
Rewriting the Bot in Java was really interesting because I faced a problem I don’t usually have when building backend applications. Most of the time the GC works well and I don’t even have to worry about it.
As explained in the first article the bot has a max amount of time per turn, if it fails to provide an answer, the bot dies. So you have to make sure your bot is fast enough all the time. But before we start blaming the GC lets see what we are talking about.
The Model
We basically have a Map, that contains a matrix of Cells and each Cell has a type, an owner and a few other small attributes. To add some numbers each map contains 13*11=143 Cells. Not a big deal right? What happens if we now try to simulate different scenarios (maps) so we can pick the best movement for our bot? Remember the decision tree from the first post:
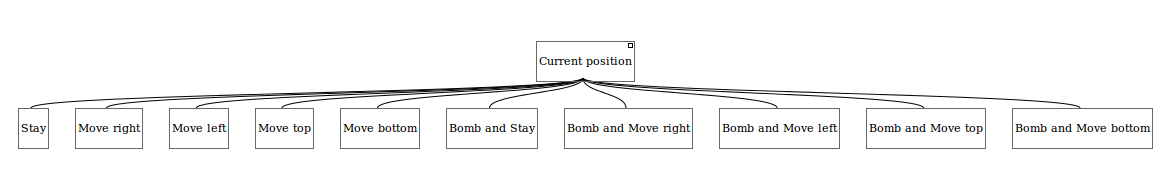
This means that simulating just one turn would require 10 new Maps, or 1430 Cells. And unfortunately simulating just one move won’t make your bot survive, if you want to be a clever bot you have to prepare for the next 6 or 7 moves maybe more. That is 10^6 Maps or 143.000.000 Cells for a simple bot that simulates 6 turns.
Okay okay, numbers are not exactly like that cause you can’t move left if there is an obstacle for example, so the decision tree gets smaller in most conditions. But anyways, we are just talking about simulating the next 6 turns, just put an 8 instead if the numbers are not big enough for you!
Creating millions of Cell objects is a problem, and deleting them before the next round is going to take time. We only have 100ms to do all the work… will that be enough?
The timeout
When I started working with this model I quickly noticed that after the first turns my bot was dying because of the 100ms time limit. I created a test to do a huge loop of simulations to see where the CPU was spending the time on and what the memory looked like with VisualVM, this is the result:
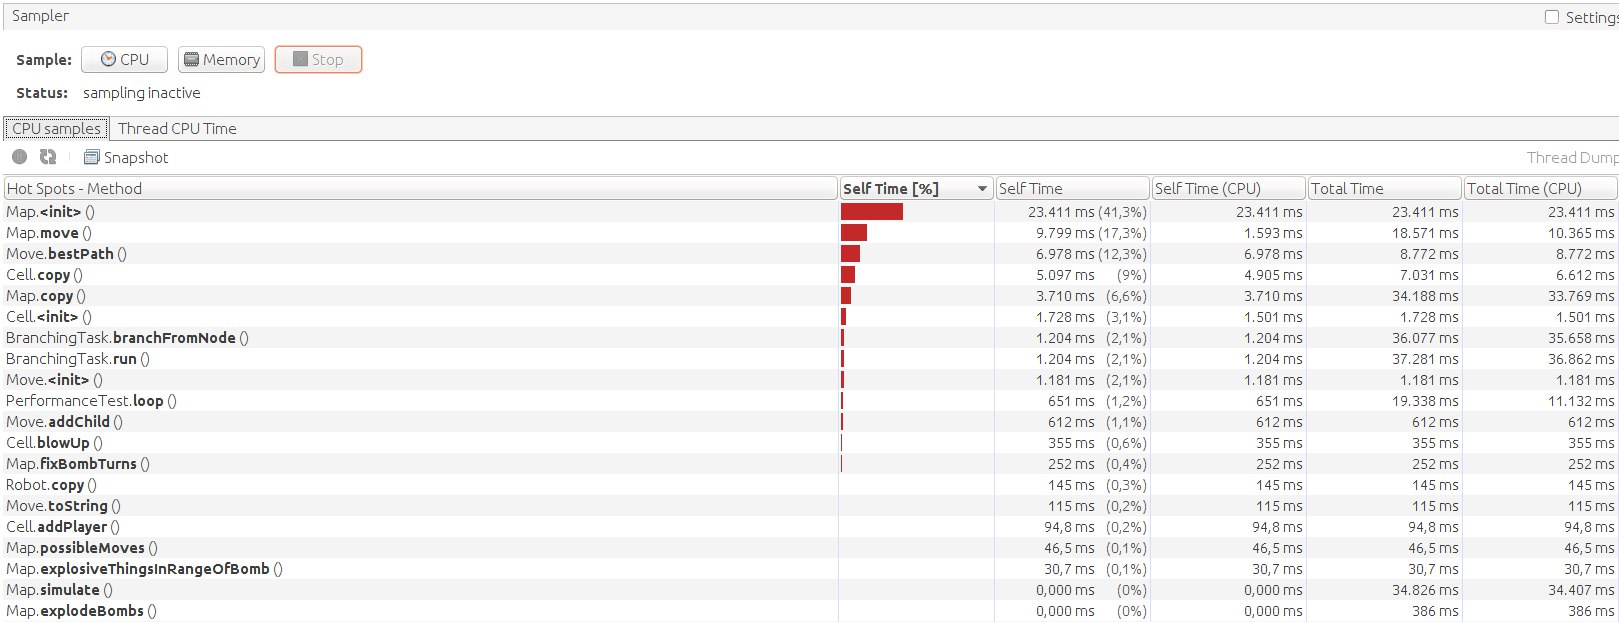
As you can see the Map.<init>() and Cell.<init>() methods are in the top 10, but that’s not a surprise cause we are creating lots of them all the time…
If we do a memory sample we can see that there are between 1 and 5 million Cell instances while doing simulations:
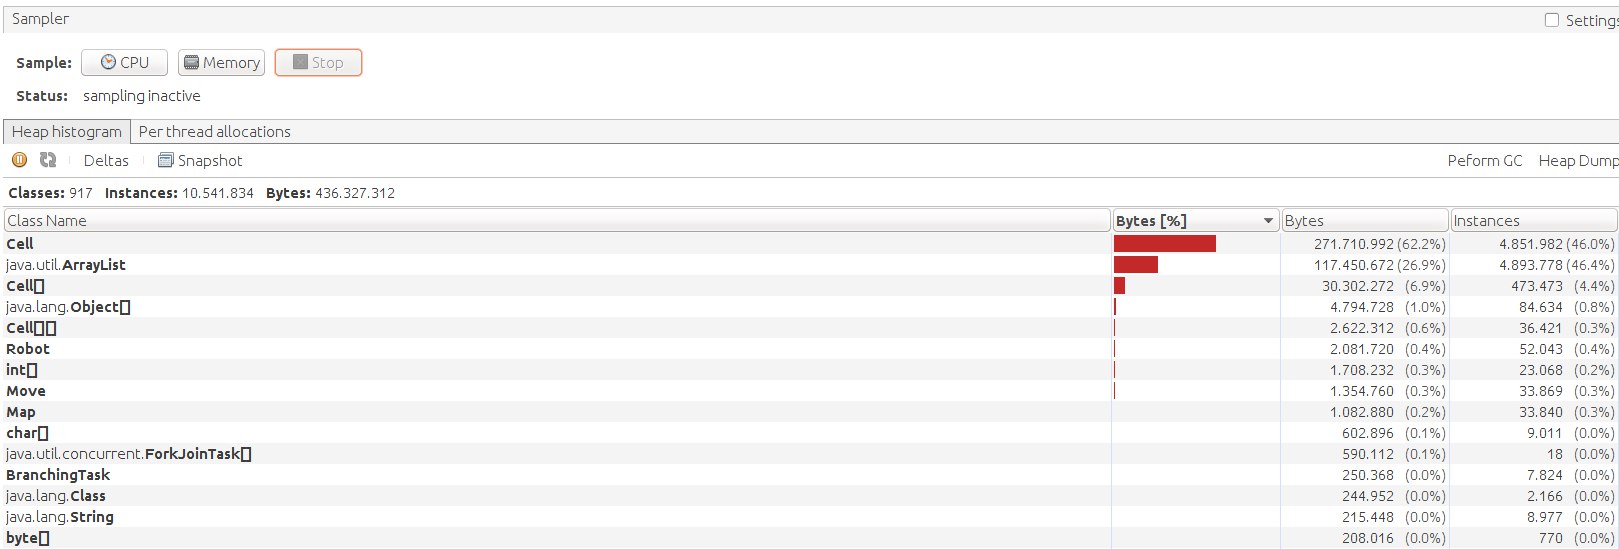
Okay, 5 million cells is a «lot», but that is not a big deal for a modern machine with a couple GB of RAM if not more, come on, we are just using 300 or 400 megabytes of ram. Where is the problem? Who is wasting so much time? I tried to find the problem placing timers everywhere around my code, without success…
If it’s not me then its the Garbage Collector
If we run the test with the -XX:+PrintGC parameter we can see where the problem is. Here is just a small bit of what the Garbage Collector does while the test is running (these lines are just a couple seconds of execution):
[GC (Allocation Failure) [PSYoungGen: 215968K->97024K(223744K)] 472107K->353163K(701952K), 0,0585879 secs] [Times: user=0,38 sys=0,00, real=0,05 secs]
[GC (Allocation Failure) [PSYoungGen: 216320K->97376K(223232K)] 472459K->353515K(701440K), 0,0588930 secs] [Times: user=0,40 sys=0,00, real=0,06 secs]
[GC (Allocation Failure) [PSYoungGen: 216672K->96416K(224256K)] 472811K->352555K(702464K), 0,0569250 secs] [Times: user=0,39 sys=0,00, real=0,06 secs]
[GC (Allocation Failure) [PSYoungGen: 217248K->98272K(223744K)] 473387K->354411K(701952K), 0,0597164 secs] [Times: user=0,41 sys=0,00, real=0,06 secs]
[GC (Allocation Failure) [PSYoungGen: 219104K->97344K(225280K)] 475243K->353483K(703488K), 0,0575258 secs] [Times: user=0,39 sys=0,00, real=0,05 secs]
[GC (Allocation Failure) [PSYoungGen: 220224K->101536K(224768K)] 476363K->357683K(702976K), 0,0525119 secs] [Times: user=0,40 sys=0,00, real=0,06 secs]
[GC (Allocation Failure) [PSYoungGen: 224416K->95840K(225280K)] 480563K->351987K(703488K), 0,0568671 secs] [Times: user=0,39 sys=0,00, real=0,06 secs]
[GC (Allocation Failure) [PSYoungGen: 217184K->98496K(224768K)] 473331K->354643K(702976K), 0,0611804 secs] [Times: user=0,40 sys=0,00, real=0,06 secs]
[GC (Allocation Failure) [PSYoungGen: 219840K->99744K(224256K)] 475987K->355891K(702464K), 0,0600649 secs] [Times: user=0,41 sys=0,00, real=0,06 secs]
[GC (Allocation Failure) [PSYoungGen: 220576K->99360K(224768K)] 476723K->355507K(702976K), 0,0515275 secs] [Times: user=0,39 sys=0,00, real=0,05 secs]
[GC (Allocation Failure) [PSYoungGen: 220192K->84288K(221696K)] 476339K->340435K(699904K), 0,0456557 secs] [Times: user=0,33 sys=0,00, real=0,05 secs]
[GC (Allocation Failure) [PSYoungGen: 202048K->58656K(176640K)] 458195K->314803K(654848K), 0,0362790 secs] [Times: user=0,21 sys=0,00, real=0,04 secs]
[GC (Allocation Failure) [PSYoungGen: 176416K->103172K(219136K)] 432563K->417744K(697344K), 0,1127996 secs] [Times: user=0,65 sys=0,00, real=0,11 secs]
[GC (Allocation Failure) [PSYoungGen: 212740K->88320K(219136K)] 527312K->505656K(697344K), 0,1798668 secs] [Times: user=0,86 sys=0,01, real=0,18 secs]
[Full GC (Ergonomics) [PSYoungGen: 88320K->0K(219136K)] [ParOldGen: 417336K->91084K(466944K)] 505656K->91084K(686080K), [Metaspace: 13421K->13421K(1060864K)], 0,2808667 secs] [Times: user=1,24 sys=0,00, rea
l=0,28 secs]
[GC (Allocation Failure) [PSYoungGen: 109568K->87584K(219136K)] 200652K->178668K(686080K), 0,0853769 secs] [Times: user=0,43 sys=0,00, real=0,09 secs]
[GC (Allocation Failure) [PSYoungGen: 197152K->89408K(219136K)] 288236K->180660K(686080K), 0,1071117 secs] [Times: user=0,45 sys=0,00, real=0,10 secs]
[GC (Allocation Failure) [PSYoungGen: 198976K->88096K(217088K)] 290228K->179348K(684032K), 0,0996079 secs] [Times: user=0,38 sys=0,00, real=0,10 secs]
[GC (Allocation Failure) [PSYoungGen: 197664K->88384K(218112K)] 288916K->179636K(685056K), 0,0682894 secs] [Times: user=0,39 sys=0,00, real=0,06 secs]
[GC (Allocation Failure) [PSYoungGen: 197952K->89248K(218112K)] 289204K->180500K(685056K), 0,0780217 secs] [Times: user=0,48 sys=0,00, real=0,08 secs]
[GC (Allocation Failure) [PSYoungGen: 201888K->91872K(219136K)] 293140K->183132K(686080K), 0,0630557 secs] [Times: user=0,42 sys=0,00, real=0,06 secs]
[GC (Allocation Failure) [PSYoungGen: 204512K->92704K(221696K)] 295772K->183964K(688640K), 0,0610758 secs] [Times: user=0,42 sys=0,00, real=0,06 secs]
[GC (Allocation Failure) [PSYoungGen: 209952K->96000K(221696K)] 301212K->187260K(688640K), 0,0588597 secs] [Times: user=0,41 sys=0,00, real=0,06 secs]
[GC (Allocation Failure) [PSYoungGen: 213248K->94752K(223744K)] 304508K->186012K(690688K), 0,0569589 secs] [Times: user=0,37 sys=0,00, real=0,05 secs]
See those numbers at the end of each line? That is the time the GC is consuming every time it does a garbage collection. Your program blocks while the GC is doing this.
It is pretty quick, but spending 0.05 seconds when you only have 0.10 seconds to give an answer is a big problem. And even if your bot is so fast it just needs 0.01 seconds for simulating you aren’t safe cause sometimes the GC does a full GC and your bot is dead, as you can see that took 0.28 seconds in my machine.

Taming the GC (spoiler: you can’t)
That’s what I tried to do. If the GC is the problem I will have to find out how to make it run faster, or run «later» or whatever, but please get out of my way you are killing my bot!
Unfortunately the problem is not the GC, the problem is that I am creating and deleting millions of objects in milliseconds. The only real solution is creating less objects… Yeah, so smart.
Lets think about the model again. Each Cell is an object. Why? If a Cell is just an empty cell, aren’t all empty cells the same? If two cells have a bomb exploding in 5 turns, why am I using two objects instead of one? How about an obstacle? Maybe I can use a limited set of objects instead of creating new ones all the time.
And this is how the CellFactory was born. There is just one empty cell for all maps that I create, and the same happens to walls. Boxes and bombs are a bit different: I create objects if needed but when there is already an object with the same parameters, I reuse it instead. For example bombs, there is a «bomb pool» where all bomb objects are stored once created so they can be reused.
The important change behind this new model is that now Cells are immutable. We don’t want anyone to modify a Cell that is being used in hundreds of Maps…
Forget about the GC
Now that we have less objects the GC should be less busy, lets run the test again and see what the GC is doing:
[GC (Allocation Failure) [PSYoungGen: 320416K->2144K(324096K)] 342060K->23788K(363520K), 0,0018400 secs] [Times: user=0,01 sys=0,00, real=0,00 secs]
[GC (Allocation Failure) [PSYoungGen: 322656K->736K(324608K)] 344300K->22380K(364032K), 0,0017102 secs] [Times: user=0,01 sys=0,00, real=0,00 secs]
[GC (Allocation Failure) [PSYoungGen: 321243K->352K(324608K)] 342887K->21996K(364032K), 0,0013988 secs] [Times: user=0,00 sys=0,00, real=0,00 secs]
[GC (Allocation Failure) [PSYoungGen: 321376K->3552K(324608K)] 343020K->25996K(364032K), 0,0082482 secs] [Times: user=0,01 sys=0,00, real=0,01 secs]
[GC (Allocation Failure) [PSYoungGen: 324576K->1024K(323584K)] 347020K->26756K(363008K), 0,0055957 secs] [Times: user=0,03 sys=0,00, real=0,00 secs]
[GC (Allocation Failure) [PSYoungGen: 320512K->224K(324096K)] 346244K->26508K(363520K), 0,0014869 secs] [Times: user=0,01 sys=0,00, real=0,01 secs]
[GC (Allocation Failure) [PSYoungGen: 319712K->384K(324096K)] 345996K->26668K(363520K), 0,0009987 secs] [Times: user=0,01 sys=0,00, real=0,01 secs]
[GC (Allocation Failure) [PSYoungGen: 320384K->3776K(324096K)] 346668K->30060K(363520K), 0,0075971 secs] [Times: user=0,02 sys=0,00, real=0,01 secs]
[GC (Allocation Failure) [PSYoungGen: 323776K->1312K(324096K)] 350060K->27596K(363520K), 0,0020534 secs] [Times: user=0,01 sys=0,00, real=0,00 secs]
[GC (Allocation Failure) [PSYoungGen: 320800K->384K(324096K)] 347084K->26668K(363520K), 0,0023313 secs] [Times: user=0,01 sys=0,00, real=0,00 secs]
[GC (Allocation Failure) [PSYoungGen: 319872K->1856K(323072K)] 346156K->28140K(362496K), 0,0020876 secs] [Times: user=0,01 sys=0,00, real=0,00 secs]
[GC (Allocation Failure) [PSYoungGen: 321344K->896K(323584K)] 347628K->27180K(363008K), 0,0012936 secs] [Times: user=0,01 sys=0,00, real=0,00 secs]
[GC (Allocation Failure) [PSYoungGen: 320384K->512K(324608K)] 346668K->26796K(364032K), 0,0023532 secs] [Times: user=0,01 sys=0,00, real=0,00 secs]
[GC (Allocation Failure) [PSYoungGen: 321024K->320K(324608K)] 347308K->26604K(364032K), 0,0023499 secs] [Times: user=0,00 sys=0,00, real=0,00 secs]
[GC (Allocation Failure) [PSYoungGen: 320832K->2720K(324608K)] 347116K->29004K(364032K), 0,0022481 secs] [Times: user=0,01 sys=0,00, real=0,00 secs]
[GC (Allocation Failure) [PSYoungGen: 323232K->192K(324608K)] 349516K->26500K(364032K), 0,0021050 secs] [Times: user=0,01 sys=0,00, real=0,01 secs]
[GC (Allocation Failure) [PSYoungGen: 320704K->4064K(322560K)] 347012K->30964K(361984K), 0,0069905 secs] [Times: user=0,02 sys=0,00, real=0,01 secs]
[GC (Allocation Failure) [PSYoungGen: 322528K->992K(323584K)] 349428K->31932K(363008K), 0,0042093 secs] [Times: user=0,02 sys=0,00, real=0,01 secs]
[GC (Allocation Failure) [PSYoungGen: 319444K->384K(322560K)] 350384K->31324K(361984K), 0,0013399 secs] [Times: user=0,00 sys=0,00, real=0,00 secs]
[GC (Allocation Failure) [PSYoungGen: 318848K->384K(323072K)] 349788K->31324K(362496K), 0,0009698 secs] [Times: user=0,00 sys=0,00, real=0,00 secs]
[GC (Allocation Failure) [PSYoungGen: 318848K->4576K(322048K)] 349788K->35596K(361472K), 0,0035996 secs] [Times: user=0,02 sys=0,00, real=0,00 secs]
[GC (Allocation Failure) [PSYoungGen: 322016K->2080K(323072K)]
353036K->37636K(362496K), 0,0052517 secs] [Times: user=0,03 sys=0,00, real=0,00 secs]
[Full GC (Ergonomics) [PSYoungGen: 2080K->0K(323072K)] [ParOldGen: 35556K->4541K(40448K)] 37636K->4541K(363520K), [Metaspace: 11166K->11166K(1058816K)], 0,0199558 secs] [Times: user=0,06 sys=0,00, real=0,02 secs]
[GC (Allocation Failure) [PSYoungGen: 317440K->3616K(323072K)] 321981K->8157K(363520K), 0,0033149 secs] [Times: user=0,02 sys=0,00, real=0,01 secs]
[GC (Allocation Failure) [PSYoungGen: 321056K->480K(323072K)] 325597K->7970K(363520K), 0,0027608 secs] [Times: user=0,01 sys=0,00, real=0,01 secs]
Now a full garbage collection takes 0.02 seconds, and minor garbage collection takes 0.00 seconds usually. This is way better isn’t it?
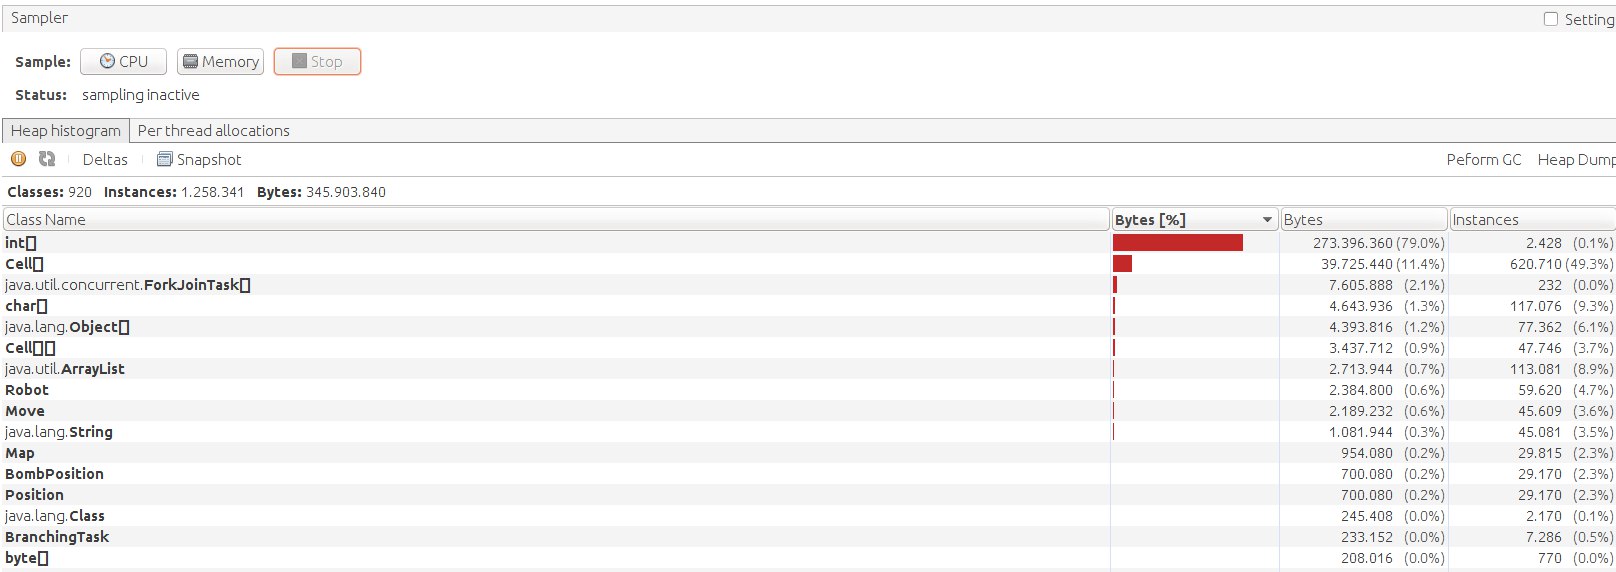
Also the amount of objects in memory has been reduced drastically:
So next time you see a strange performance issue check the GC and if it is taking too much time consider changing your model to reduce the number of instances being created and destroyed.
(I’m Magus from codingame)
I don’t use Java on codingame, but i use it on a daily base for my job. On codingame i use C++. Maybe you can think «C++ is so fast i can do what i want», but it’s false.
C++ has the exact same problem : creating and deleting object is slow. It’s a pitfall for performances. As a rule of thumb : Never create or delete an object in a critical code. Create every instances you need during the first turn and store it in some arrays. Re-use this objects. Don’t delete them.
Hello David!
Yeah exactly, «use C» (or C++) is the number one recipe/joke when you search for garbage collector problems in Java, but the GC does a really good job most of the time and using C++ with the same model won’t help.
As you say, reusing objects or reducing the number of them in your model is a more reasonable way of dealing with GC issues I think.
Thank you for your comment!